Remote Debugging with GDB

The GNU Debugger (GDB) is a portable debugger that runs on many Unix-like systems and works for many programming languages, including Ada, C, C++, Objective-C, Free Pascal, Fortran, Go, and partially others.
In the previous post, I have covered how to integrate CMake into VSCode and cross-compiling for arm based boards. Then, the executable binary has been run on the Raspberry pi 3 v2 board. But, the debugging feature has not been enabled yet.
Today, gdb is going to be attached to VSCode for remote debugging. Then, we can debug our code remotely, which runs on the arm based board such as Raspberry Pi, Orange Pi, Beaglebone, NXP IMX, etc.
a.Gdb Integration to VSCode

1)Click the RUN tab.
2)Click “create a launch.json file” for GDB settings
3) When number 2 instruction is applied, a pop-up comes up. Please, click “C++ (GDB/LDB)” . Then, the “launch.json” file is created by VSCode. GDB configuration should be done in it.

1)To add a new GDB configuration, click “Add Configuration…”
2) Please select “C/C++: (gdb) Launch”
The “launch.json” should look like the following:
{"configurations": [{"name": "(gdb) Launch","type": "cppdbg","request": "launch","program": "${workspaceFolder}/build/HelloWorldProject","args": [],"miDebuggerServerAddress": "YOUR_BOARD_IP:PORT_NO","stopAtEntry": true,"cwd": "${workspaceRoot}","environment": [],"externalConsole": true,"targetArchitecture": "arm","MIMode": "gdb","miDebuggerPath": "TEST_PROJECT_PATH/test-project/toolchain/gcc-linaro-7.4.1-2019.02-x86_64_arm-linux-gnueabihf/bin/arm-linux-gnueabihf-gdb","setupCommands": [{"description": "Enable pretty-printing for gdb","text": "-enable-pretty-printing","ignoreFailures": true}]}]}
Note: “miDebuggerServerAddress” variable should be set board ip and port number.
For instance, Let’s assume that the IP of board is 192.168.8.30, and port number which you want to connect is 9080. Then, setting could be “miDebuggerServerAddress”: “192.168.8.30:9080”.
“miDebuggerPath” variable should be set to where “arm-linux-gnueabihf-gdb” is. “TEST_PROJECT_PATH” presents project path. You should change it based on where your project folder is.
b. Enabling Gdb Server
First of all, you have to make sure about the gdbserver existence on the board. When gdbserver command is being run on the board, the output is the picture shown below.

Before starting to debug, some steps must be done following:
1) The latest executable binary is sent to the board. scp command can be run to achieve this mission.
2) SSH connection must be established with the board and run gdbserver inside the board.
I will edit the CMakeLists.txt file which is written in the previous post to enable two steps above. Two custom commands will be enabled in the CMakeLists.txt file. The purpose of the first one is only building code and the purpose of the other is building code, sending executable binary to the board, and run gdbserver in it. The content of CMakeLists.txt file should be like the following:
#Project version minimum
cmake_minimum_required(VERSION 3.12.2)#Project name
project(HelloWorldProject VERSION 1.0.0)#source files directoryset(Source_Files"src/main.c")set(ALL_FILES ${Source_Files})
add_executable(${PROJECT_NAME} ${ALL_FILES})
set(TARGET_BINARY HelloWorldProject)#Custom target for Only Building
add_custom_target(build ALL)#Custom target for build and debug with GDB
add_custom_target(build_and_debug ALL DEPENDS ${TARGET_BINARY})#Board IP
set(BOARD_IP xxx.xxx.xxx.xxx)#Port no
set(PORT_NO xxxx)add_custom_command(TARGET build_and_debug POST_BUILD
COMMAND scp ${CMAKE_CURRENT_BINARY_DIR}/${TARGET_BINARY} root@${BOARD_IP}:/home/root
COMMAND ssh -f -L${PORT_NO}:localhost:${PORT_NO} root@${BOARD_IP} 'gdbserver :${PORT_NO} ./${TARGET_BINARY}')
Note: You have to do some changes on the CmakeLists.txt file given above.
set(BOARD_IP xxx.xxx.xxx.xxx)
You should write your board ip instead of “xxx.xxx.xxx.xxx” . On the other hand, board ip have to match with YOUR_BOARD_IP which is set in “miDebuggerServerAddress”
set(PORT_NO xxxx)
You should write your board ip instead of “xxxx”. PORT_NO also must be matched with PORT_NO which is set in “miDebuggerServerAddress”.
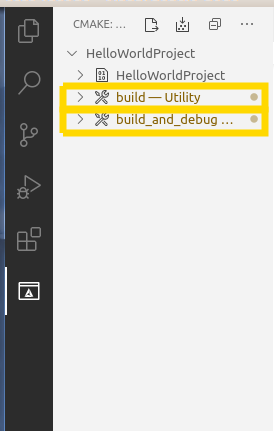
CTRL+P combination must be used to apply changes again. Then, run “>Cmake:Delete Cache and Reconfigure” and press enter. This command has been shown in the previous post. After applying instructions, two commands should be created in the VSCode CMake tab as the picture shown below.

c) Starting Debug Session
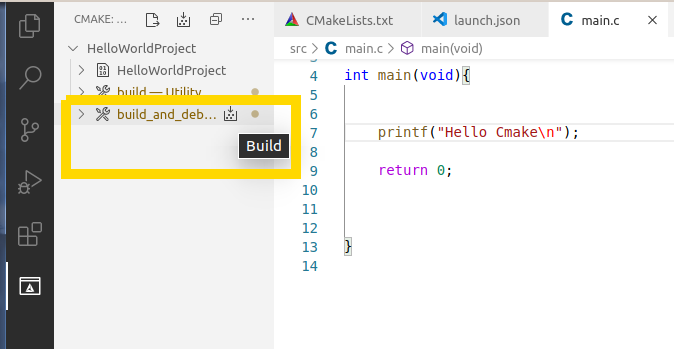
- Click build_and_debug command.

- After running the command, the output should look like below.

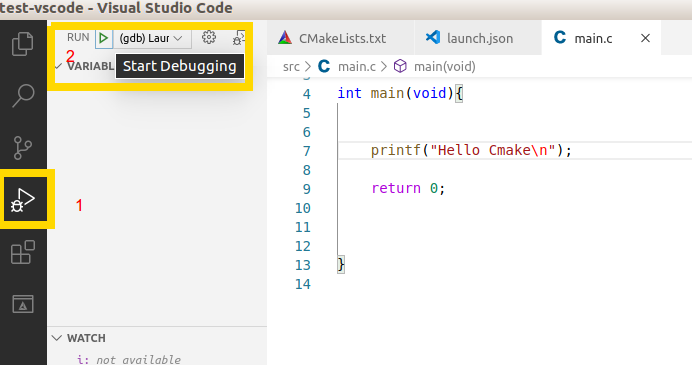
- Click RUN to start debugging

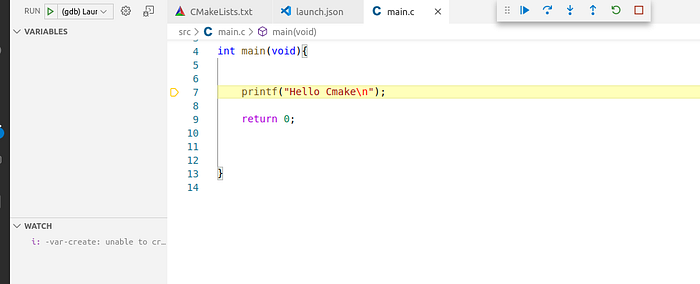
- Then, the debug session should be started. Now, enjoy debugging your code :)

Thank you for reading :). If there is something wrong, please let me know.
Enes ÖZTÜRK, 2020
References
